





How to use lifecycle cost optimization to time equipment replacement
Replacing industrial equipment too early ties up capital; waiting too long can turn maintenance savings into costly downtime. Lifecycle cost optimization provides a disciplined way to decide when repair, overhaul, or replacement offers the strongest economic outcome. The decision depends on more than purchase price: energy consumption, maintenance demands, production losses, failure exposure, and residual value all change as equipment ages.
The practical question is not “How old is this machine?” It is “What will it cost to deliver the required production reliably from this point forward?” That distinction matters. A well-maintained older transmission may remain economical, while a newer hydraulic system can become expensive if it operates inefficiently or repeatedly contaminates the process.
Compare future service, not past spending
Equipment replacement analysis should start with a defined service requirement: throughput, operating hours, accuracy, pressure, torque, availability, and acceptable quality. Without that baseline, a lower-cost option may simply deliver less useful output.
Past acquisition and repair expenditure are generally sunk costs. They explain the asset’s history but do not justify keeping it. Its current sale value, however, matters because retaining the asset means giving up the opportunity to sell it now. Tax effects and accounting treatment may also affect cash flows and should be checked with finance.
Compare credible alternatives over the same planning horizon: continued operation with targeted repairs, a defined overhaul, and replacement. If their useful lives differ, include subsequent replacements or defensible terminal values. Equivalent annual cost can help where repeat-service assumptions are reasonable; it should not conceal major differences in capacity or risk.
A practical model is: present-value cost = initial net cash outlay + discounted operating, maintenance, downtime, and end-of-life costs − discounted residual value.
Use a consistent treatment of inflation and discount rates. Include the current asset’s disposal proceeds in the replacement option, or its opportunity cost in the retention option—not both. Compare net present value rather than cost alone when an alternative produces materially different revenue or saleable output.
Build the cost picture around how the machine actually works
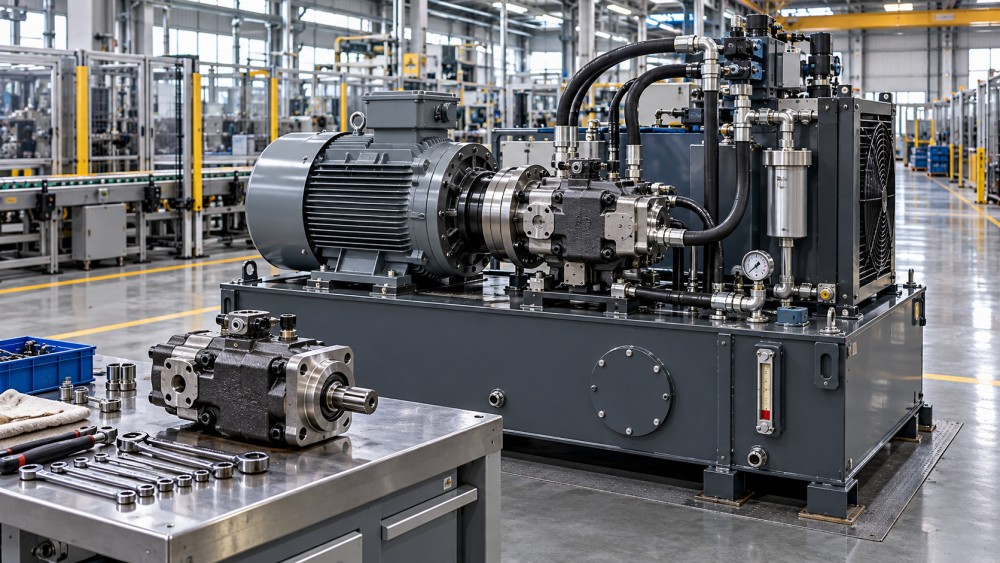
Maintenance invoices rarely capture the full economic burden. A hydraulic pump can still produce pressure while consuming more energy because of internal leakage. A worn belt drive may continue running but require repeated tension adjustment. Bearing deterioration can affect dimensional accuracy before it causes a stoppage.
Connect the financial model to those operating mechanisms. Collect work orders, component consumption, energy measurements, quality records, and production interruptions by asset. Separate planned maintenance from corrective work, and identify whether repeated failures share an unresolved cause such as misalignment, contamination, unsuitable lubrication, or excessive loading.
For downtime, use lost contribution margin rather than automatically multiplying idle hours by sales revenue. If inventory, spare capacity, or another line can absorb the interruption, the economic loss may be smaller. Conversely, a relatively inexpensive component can create substantial exposure when it stops a bottleneck process.
Avoid counting the same loss twice. A failure consequence estimate that already includes repair labor and scrap should not add those amounts again elsewhere. Safety, environmental, and compliance requirements also remain constraints: an attractive cost forecast cannot justify operation outside acceptable limits.
Turn the cost comparison into a replacement window
A one-time comparison of “keep” versus “replace” is not enough to establish timing. Evaluate several feasible dates: the next shutdown, a later maintenance window, and continued operation beyond that point. Each schedule should include the costs incurred before replacement, the installation event, and subsequent operating costs.
The economic trigger appears when deferring replacement costs more than it saves, after accounting for uncertainty and capital constraints. Deferral saves an immediate investment and may preserve flexibility. Against that, it can increase repairs, energy consumption, failure exposure, and the loss of resale value.
Compare complete schedules rather than assuming every maintenance increase warrants replacement. A repair-heavy year may reflect a planned overhaul that restores serviceability. Equally, a quiet maintenance year may hide deteriorating condition if inspections were deferred.
A useful decision chart plots the discounted cost of each replacement schedule against its proposed installation date, with uncertainty ranges and shutdown windows marked. The lowest-cost region is often more useful than a supposedly exact optimum date.
Lead time can move the purchasing decision well ahead of the installation decision. Supplier capacity, engineering approval, controls compatibility, transport, and commissioning resources all affect the latest safe order date. Waiting for a strong financial trigger is risky if replacement equipment cannot arrive before the asset’s credible operating limit.
Use condition data to narrow uncertainty—not promise a failure date
Condition monitoring makes lifecycle cost optimization more useful when measurements change a decision. For bearings, vibration trends, temperature, and lubricant debris can inform inspection priorities. For hydraulic systems, pressure-flow performance, case-drain behavior, fluid cleanliness, and temperature can help distinguish wear from system-level problems. Chain elongation, sprocket wear, belt condition, and alignment provide different evidence for transmission equipment.
Interpret readings against load, speed, duty cycle, and measurement consistency. A vibration increase after a production-rate change is not automatically proof of accelerated damage. Likewise, a seal leak may reflect incompatible material, shaft condition, or pressure transients rather than age alone.
Translate findings into a range of plausible operating outcomes. Expected failure cost can be estimated from event probability and consequence, but both inputs need defensible assumptions. Where evidence is weak, use scenarios instead of presenting an unsupported probability as a precise forecast.
Keep high-consequence events visible outside the average-cost calculation. A low estimated probability does not make a major safety incident acceptable. Monitoring also has limits: some failure modes develop quickly or are poorly detectable, so a stable trend does not guarantee safe operation until the next shutdown.
Choose the right scope: repair, overhaul, or replacement
The most expensive mistake can be defining the replacement scope incorrectly. Replacing an entire machine because of a recoverable spindle problem wastes capital. Repeatedly replacing bearings without correcting a damaged housing or lubrication defect wastes maintenance effort.
- Targeted repair fits localized damage when the surrounding asset remains sound, supportable, and capable of meeting production requirements.
- Overhaul deserves consideration when inspection can establish what will be restored, what remains life-limited, and how post-overhaul performance will be accepted.
- Replacement becomes more compelling when deterioration spans several systems, required performance has changed, support is disappearing, or repairs cannot restore acceptable reliability.
Request evidence that matches the proposed benefit. Energy-saving claims need a representative duty point and system boundary. Longer seal life requires compatibility with the actual medium, temperature, pressure, and cleaning regime. Bearing selection must consider load, speed, fits, lubrication, contamination, and installation—not catalog life alone.
Global Precision Components & Transmission Systems (PCTS) connects component-level analysis with maintenance economics across bearings, fluid power, sealing, and mechanical transmission. Its technical and supplier information can help frame these comparisons. Final forecasts still need plant records, application-specific engineering, and confirmed supplier scope.
Approve a decision with conditions, not just a spreadsheet
Before committing capital, test the assumptions most likely to reverse the result: utilization, energy price, repair frequency, outage duration, commissioning delay, and residual value. Use plausible scenarios grounded in operating records and supplier information. If replacement only wins under optimistic utilization and flawless commissioning, its business case is fragile.
The approval should state the preferred option, installation window, latest order date, and conditions for reconsideration. Those conditions might include a deteriorating inspection result, loss of spare-part availability, or a change in production demand. Assign responsibility for reviewing them; otherwise, a conditional deferral easily becomes indefinite postponement.
Where several assets compete for funding, compare feasible schedules across the portfolio. Criticality, shared shutdown opportunities, and installation resources may justify a sequence different from ranking individual payback periods. Preserve enough maintenance capacity to keep deferred assets within acceptable operating limits.
After implementation, compare actual energy use, maintenance demand, availability, and ramp-up losses with the approved assumptions. That feedback improves the next replacement decision. The immediate next step is straightforward: select one critical asset, establish its service requirement, and build a forward-looking comparison of repair, overhaul, and timed replacement using evidence the team can defend.
Related News
- 00
0000-00
How to check a heavy-duty chain drive distributor’s stock availability - 00
0000-00
Can condition monitoring solutions for motors detect bearing faults? - 00
0000-00
Changsheng Bearings Reports 22.68% Revenue Growth for First Nine Months of 2026 - 00
0000-00
How to assess export compliance readiness before your first shipment - 00
0000-00
Is the Cheapest Replacement Part Really Lower Cost Over Time?
Weekly Insights
Stay ahead with our curated technology reports delivered every Monday.